
CASE STUDYRevenue and Inventory Intelligence for Event-Based Business
Camvia cleaned fragmented sales and inventory data, built a usable reporting model, and helped the owner make better event and product decisions.
Turning spreadsheets and disconnected systems into a clear, reliable dashboard for confident business decisions.

Dashboard reporting + data cleanup
Faster Reporting
Drastically reduced manual reporting time and effort.

Better Event Decisions
Clear event comparisons drive smarter planning and focus.

Inventory Visibility
Real-time inventory insight supports better stocking.

The Challenge
Data lived in inconsistent spreadsheets with duplicates and missing values. There was no clear way to compare events, track top products, or see inventory in real time. Reporting took 4+ hours each week and was difficult to trust.

What Camvia Built
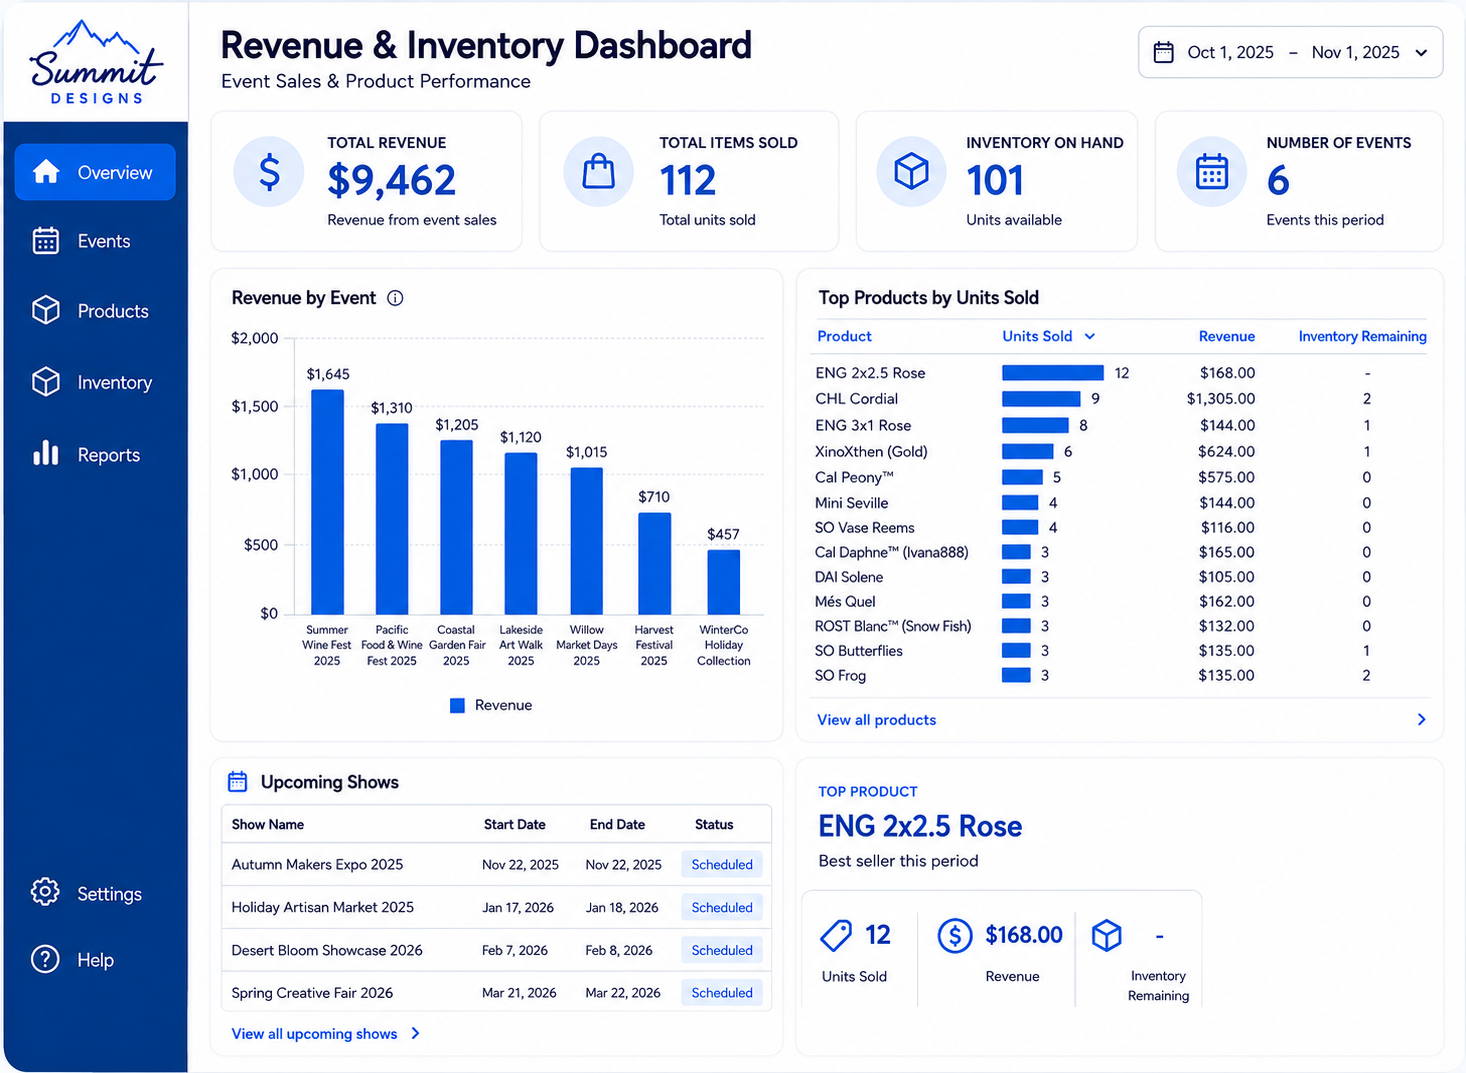
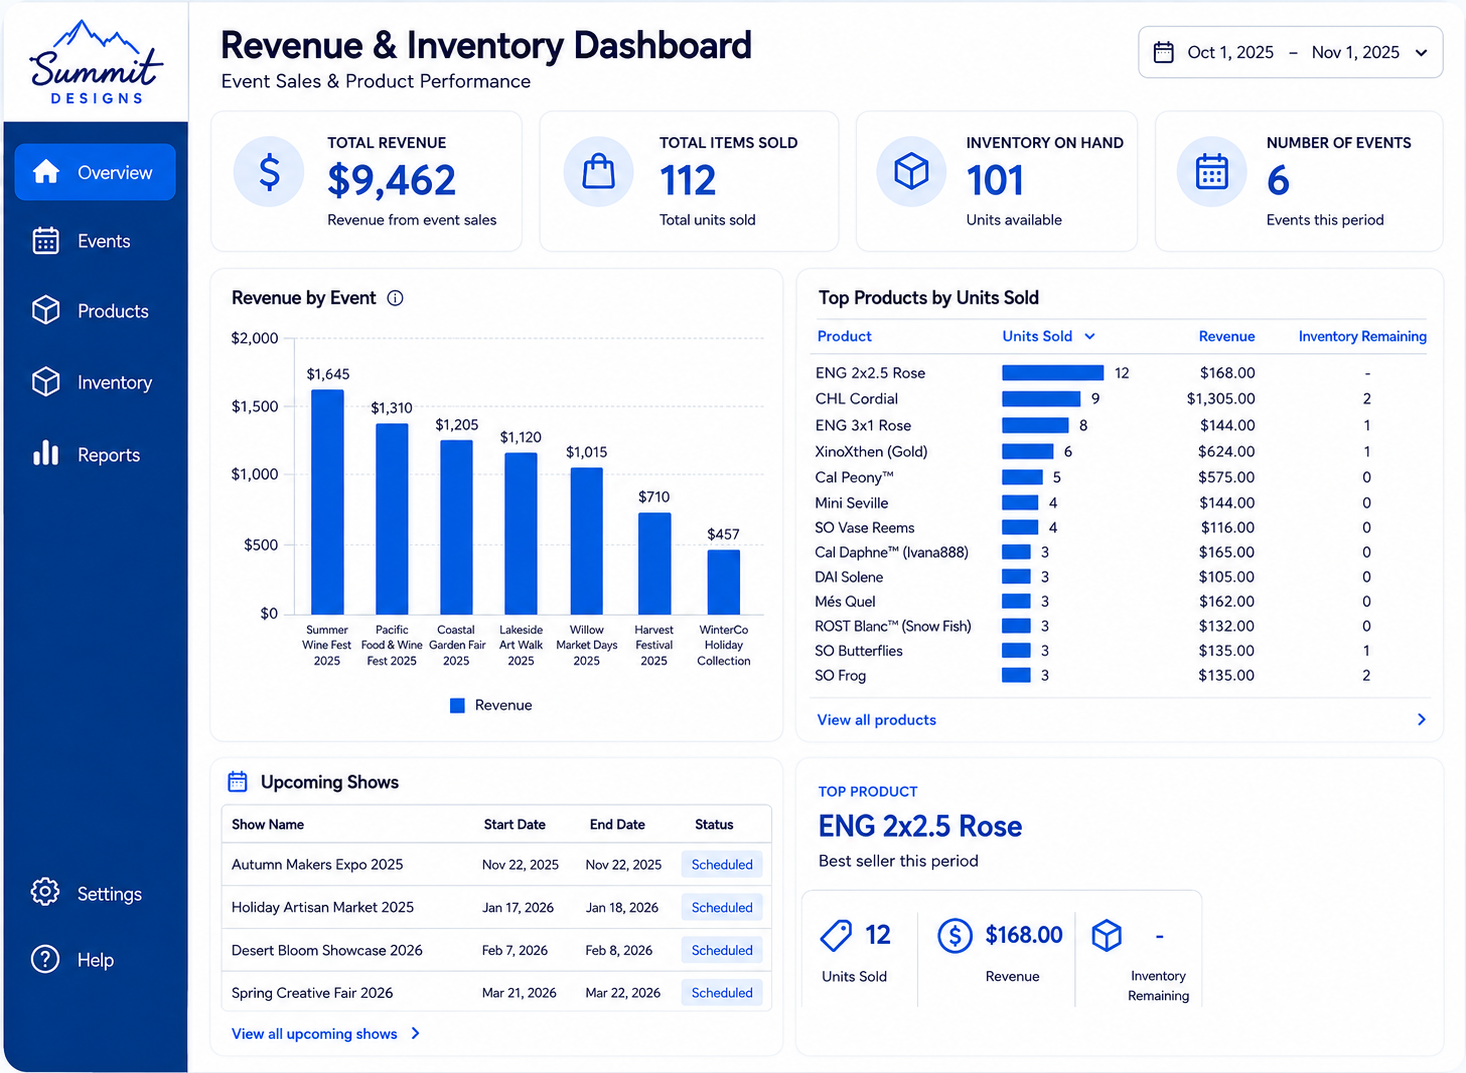
We cleaned and standardized source data, built a structured reporting model, and designed a Power BI dashboard that brings together revenue, events, products, inventory, and upcoming shows in one easy-to-use view.
The Reporting Workflow
Dashboard Preview
Client branding, event names, product names, and selected figures have been changed to protect confidential business information.
Reporting Time Cut
From 4+ hours/week to under 30 minutes.

Operational Impact
Better Event Visibility
See performance across all events.

Improved Product Planning
Identify best sellers and plan inventory more effectively.
Cleaner Data Structure
Consistent, reliable data you can trust.

Foundation
Model that grows with business needs.
